 Neuerscheinungen 2019Stand: 2020-02-01 |
Schnellsuche
ISBN/Stichwort/Autor
|
Herderstraße 10
10625 Berlin
Tel.: 030 315 714 16
Fax 030 315 714 14
info@buchspektrum.de |

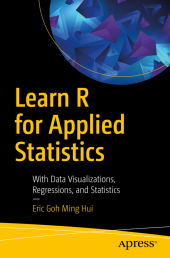
Eric Goh Ming Hui Hui
Learn R for Applied Statistics
With Data Visualizations, Regressions, and Statistics
1st ed. 2019. xv, 243 S. 111 SW-Abb. 235 mm
Verlag/Jahr: SPRINGER, BERLIN; APRESS 2019
ISBN: 1-484-24199-1 (1484241991)
Neue ISBN: 978-1-484-24199-8 (9781484241998)
Preis und Lieferzeit: Bitte klicken
Gain the R programming language fundamentals for doing the applied statistics useful for data exploration and analysis in data science and data mining. This book covers topics ranging from R syntax basics, descriptive statistics, and data visualizations to inferential statistics and regressions. After learning R´s syntax, you will work through data visualizations such as histograms and boxplot charting, descriptive statistics, and inferential statistics such as t-test, chi-square test, ANOVA, non-parametric test, and linear regressions.
Learn R for Applied Statistics is a timely skills-migration book that equips you with the R programming fundamentals and introduces you to applied statistics for data explorations.
What You Will Learn
Discover R, statistics, data science, data mining, and big data
Master the fundamentals of R programming, including variables and arithmetic, vectors, lists, data frames, conditional statements, loops, and functions
Work with descriptive statistics
Create data visualizations, including bar charts, line charts, scatter plots, boxplots, histograms, and scatterplots
Use inferential statistics including t-tests, chi-square tests, ANOVA, non-parametric tests, linear regressions, and multiple linear regressions
Who This Book Is For
Those who are interested in data science, in particular data exploration using applied statistics, and the use of R programming for data visualizations.
Chapter 1: Introduction Chapter Goal: To understand what is R, why use R, statistics in data mining and data science No of pages 15 Sub -Topics 1. What is R? 2. High Level and Low Level Language 3. What is Statistics? 4. What is Data Science? 5. What is Data Mining? 6. What is Text Mining? 7. Three Types of Analytics 8. Big Data 9. Why R? 10. Conclusion
Chapter 2: Getting Started Chapter Goal: To set up the computer for R Programming No of pages: 15 Sub - Topics 1. What is R and RStudio? 2. Installation of R and RStudio 3. Integrated Development Environment 4. RStudio - The IDE for R. 5. Conclusion Chapter 3: Basic Syntax Chapter Goal: To learn R programming basics No of pages : 30 Sub - Topics: 1. Writing in R Console 2. Using Code Editor 3. Variables and Data Types 4. Vectors 5. Lists 6. Data Frame 7. Logical Statements 8. Loops 9. Functions 10. Conclusion
Chapter 4: Descriptive Statistics Chapter Goal: To learn Descriptive Statistics in R No of pages: 20 Sub - Topics: 1. Reading Data Files 2. Mean, Median, Min, Max, ... 3. Percentile, Standard Deviations 4. The Summary() and Str() functions 5. Distributions 6. Conclusion
Chapter 5: Data Visualizations Chapter Goal: To learn Data Visualizations in R No of pages: 20 Sub - Topics: 1. What is Data Visualizations? 2. Bar Chart, Histogram 3. Line Chart, Pie Chart 4. Scatterplot and Box Plot 5. Scatterplot Matrix 6. Decision Trees 7. Conclusion
Chapter 6: Inferential Statistics and Regressions Chapter Goal: To learn inferential statistics and regressions in R No of pages: 20 Sub - Topics: 1. Correlations 2. T Test, Chi Square, ANOVA 3. Non Parametric Test 4. Linear Regressions 5. Multiple Linear Regressions


